dept | resources | glossary | credits | feedback | help | search |
|||||||||||||||||||||||||||||||||||||||||||||||||||||||||||||||||||||||||||||||||||||||||||||||||||||||||||||||||||||||||||||||||||||||||||||||||||||||||||||||||
 |
|||||||||||||||||||||||||||||||||||||||||||||||||||||||||||||||||||||||||||||||||||||||||||||||||||||||||||||||||||||||||||||||||||||||||||||||||||||||||||||||||

|
|||||||||||||||||||||||||||||||||||||||||||||||||||||||||||||||||||||||||||||||||||||||||||||||||||||||||||||||||||||||||||||||||||||||||||||||||||||||||||||||||
 |
|||||||||||||||||||||||||||||||||||||||||||||||||||||||||||||||||||||||||||||||||||||||||||||||||||||||||||||||||||||||||||||||||||||||||||||||||||||||||||||||||
| The Harriet and Robert Heilbrunn Department of Population and Family Health |
|||||||||||||||||||||||||||||||||||||||||||||||||||||||||||||||||||||||||||||||||||||||||||||||||||||||||||||||||||||||||||||||||||||||||||||||||||||||||||||||||
 |
|||||||||||||||||||||||||||||||||||||||||||||||||||||||||||||||||||||||||||||||||||||||||||||||||||||||||||||||||||||||||||||||||||||||||||||||||||||||||||||||||
intro | use demographic stats | rates & indices | measures of the total population | conclusion | exam |
|||||||||||||||||||||||||||||||||||||||||||||||||||||||||||||||||||||||||||||||||||||||||||||||||||||||||||||||||||||||||||||||||||||||||||||||||||||||||||||||||
Measure of the Total Population Structure and Size
Population RatesCrude rates: A crude rate is used to describe the frequency of a demographic event across the total population, without regard to age or sex. The standard reference period is one year. Because the population is usually not the same at the beginning and end of the year, the denominator for crude rates is the average of the population at the beginning and end of the one year period. The numerator is the number of vital events (e.g., births, deaths) observed for the total population in the specified calendar year. Crude Birth Rate (CBR): # of births per 1,000 persons in a population over a given period of time (i.e. 1 year). This rate is most often used when looking at fertility, though the crude measure does not account for important variations in population fertility such as sex ratios, age distributions, postponement or acceleration of marriage age, all of which can alter the way that the crude rate should be interpreted.
Ranges of CBR:
Crude Death Rate (CDR) : # of deaths per 1,000 persons in a population over a given period of time (i.e. 1 year). CDR is calculated in the same way as for CBR, but with deaths instead of births as the numerator. Ranges of CDR:
crude r (rate of growth of a population) – Among locales where an estimate of the total population is available each year, estimating the growth of a population requires little more than dividing the change in population at the end of the year by the population at the beginning of the year. However, for most settings, vital statistics are collected during censuses only every few years. For these cases, we can estimate the average yearly population growth using the following formula, and solving for r.
Ranges of r:
Crude net migration rate – This rate illustrates the change in the population as it is affected by people moving in and out of a country or other specified locale. To calculate this rate, one would need to know both the number of people that immigrated to (moved into) a country or the designated district/subnational area and the number of people that emigrated from (moved out of) a country or the designated district/subnational area. Then the crude net migration rate can be calculated using the following formula:
Accurate and complete data on immigrants and emigrants is very difficult to obtain. Immigrants may be incompletely observed because countries may keep track of airplane arrivals, but seldom of all arrivals. Further, they may only note permanent resident visas, and not the conversion of visitors to residents. Forced immigrants may only include those requesting asylum, and not all forced migrants. There also are problems with the reporting of emigrants. Few governments know when people have left permanently, and they may only track departures by mode of transport (air, bus, car). Even these reports are likely to be grossly underestimated, particularly for settings with significant forced refugee movements when people cross at unregulated borders or times. Interpretation of the NMR is also problematic, as a low figure can result from low levels of movement or from high counterbalanced in and out flows. For this reason, it is generally preferred to calculate two separate crude migration rates: Crude In-migration rate (I/P * 1000) and Crude Out-Migration rate (E/P * 1000). Ranges of NMR:
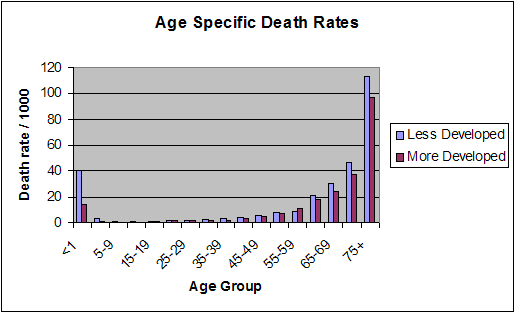
Specific Rates: As noted above, population events, particularly vital events such as births or deaths, do not affect people in all age groups in the same way. Age-specific rates are used to show the different probabilities of demographic events for each age group. Age specific rates are typically calculated for 5 year age groups, but as noted above in the discussion of age structure, these may be aggregated for several age groups where the rates do not vary much between age groups. The numerators for specific rates are the numbers of events observed in a one year period for the denominator population, namely the total population in the requisite five year age group at the beginning of the observation year. For example, the ASFR for women 20-24 would be the total number of births recorded in the given calendar year for women 20-24 divided by the total number of women 20-24 at the beginning of the calendar year. Specific Mortality Rates – Mortality rates that distinguish between different age groups help to inform public health practitioners about different kinds of health concerns. Very high death rates among children under 1 year of age may require a very different intervention than would very high death rates among adults over 70 years of age. If unfavorable changes in the crude mortality rate alone is used to gauge the health of a population, than important differentiations and programmatic responses would be impossible. Age Specific Death Rates (ASDRs)- In describing population phenomenon like mortality, rates are often calculated for specific age groups of the population to gain a more sophisticated picture of how the population is changing over time. This is especially important for gauging the efficacy of health interventions that are targeted at specific segments of the population such as children or the elderly. They are usually expressed per 1000 persons. Age Specific Death Rates are the number of deaths experienced in a single year by the specific age and sex group at risk for those deaths. The population at risk is assessed as the mid-year population. The formula is as follows:
Examples of Age Specific Death Rates:
Infant Mortality Rate (IMR): Infant mortality is the annual number of infant deaths among infants under the age of 1 year divided by the mid-year population of all infants under the age of 1 year. However, because mid-year population is only available in certain countries and only for those years in which a census takes place, the most commonly used formula is as follows: [# deaths of infants <1 yr. in the current year] /[# live births in the previous year] * 1,000
The IMR is the most widely used indicators of population health. Because an infant’s death is reflective of the mother’s well-being and nutritional status during pregnancy, the child’s nutritional status after birth and the child’s lack of protection against preventable, infectious diseases, a high IMR is an indirect measure of poor overall health and poor levels of living. Range of IMR:
Neonatal Mortality Rate (NNMR): Neonatal mortality is defined as the annual number of neonatal deaths among infants under the age of 28 days divided by the mid-year population of all infants under the age of 28 days. However, because mid-year population is only available in certain countries and only for those years in which a census takes place, the most commonly used formula is as follows:
NNMR is very often underestimated, as neonatal deaths may go unreported, particularly if the birth was never reported or the death occurs in the period before the child’s naming or baptism. High NNMR rates are important as an indicator of neonatal tetanus mortality, which is preventable by giving the mother anti-tetanus vaccines during pregnancy. A recent multisite study of developing and developed countries found marked differences in NNMR by birthweight, and between developing and developed countries. (cf. Straughn et al., Biurthweight-specific neonatal mortality in developing countries and obstetric practices. IJGyn & Obs, 80(1), Jan 2003: 71-78). ) Range of NNMR:
Cause - specific mortality rates are the number of deaths attributable to a specific disease in a given population over a given time period (usually expressed per 100,000 persons per year). For example, if among a population of 100 people, 3 people died of measles, the cause specific mortality would be as follows:
This rate is most frequently used to study the relative mortality effects of specific diseases/causes of death among a population of interest. Specific Fertility Rates - Age-specific fertility rates refer to the actual number of children born among a population of women of selected ages, over a certain period of time. Fertility may vary due to factors such as age, duration of marriage and number of previous children. The following are the principal fertility rates used by demographers to describe fertility. Children ever born (CEB)- This rate is the total number of children ever born per 1000 women aged 15 and over. CEB is a measure of cumulative fertility. The CEB is easily calculated from census or survey data which ask a women how many children she has borne. In high fertility and high mortality settings, there may be underreporting of births, specifically of children who died in infancy. The CEB also measures past fertility, and if fertility has changed significantly in the past 15 years, the estimated CEB will not reflect current fertility.
Ranges of CEB:
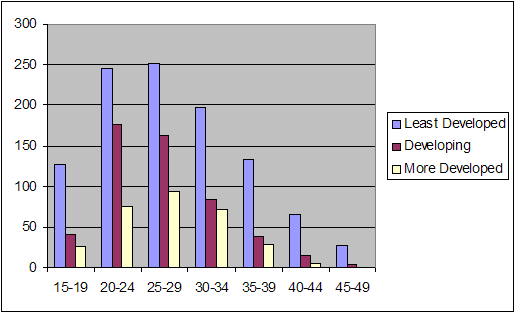
CEB is used primarily for retrospective comparisons, and is useful when there are limited data available on current fertility patterns. Because it does not include any control for age or for cohort differences in fertility, it is not a good measure of overall fertility if fertility has changed considerably over time. The CEB is most useful if calculated for the number of children every born per 1000 women for women at the end of their reproductive years, e.g. 50 or more years old, when it is called the ‘completed fertility rate’. The DHS reports completed fertility rate for women 40-49 years of age, without normalizing to 1000. The Demographic Health Survey reports include analyses of changes in CEB by cohort and over time. Age Specific Fertility Rate (ASFR)- Age-specific fertility rates are the total births in the calendar year to all women of the designated age group number of births to mothers of each age (or age group) by the number of women that age (or age group) in the population. This rate is usually expressed as births per 1,000 women of that age. ASFR can only be calculated with data on the age of the mother at birth of the child. This method of measuring fertility eliminates one of the disadvantages of a single population-wide fertility rate, by removing the distortions that can be produced by variation in the age composition of the population. However, it requires accurate reporting of births by age of the mother, and this level of accuracy may be not attained. Ranges of ASFRs:
Total Fertility Rate (TFR)- The total fertility rate of a population is a synthetic fertility rate, indicating the total number of children a woman is expected to bear during her reproductive lifetime. It is calculated by adding together the age specific fertility rates for women of each age from 15-44. If using five year age groups for the ASFRs, the TFR is calculated by multiplying the sum by 5, to factor in the five years of exposure in each age group.
The following is an example showing the calculation of TFR, using data from the Matlab project in Bangladesh.
For example, for 15-19 year olds, step one would be:
Sum the rates for all groups (in this case, 607.6) then multiply by 5 (for the 5-year age cohorts). Divide that number by 1000 to cancel the previous multiplication (see step 1). Dividing by 1,000 does not mean normalizing to 1,000 women in the population. Using the TFR eliminates the distortions due to differences in age distributions in a population that might be present in a crude fertility rate for a population. However, if fertility has recently declined, it is not an accurate reflection of total fertility for the current cohort of women just now entering the reproductive ages. Ranges of TFR:
|
|
||||||||||||||||||||||||||||||||||||||||||||||||||||||||||||||||||||||||||||||||||||||||||||||||||||||||||||||||||||||||||||||||||||||||||||||||||||||||||||||||
 |
|||||||||||||||||||||||||||||||||||||||||||||||||||||||||||||||||||||||||||||||||||||||||||||||||||||||||||||||||||||||||||||||||||||||||||||||||||||||||||||||||


