dept | resources | glossary | credits | feedback | help | search |
|||||||||||||||||||||||||||
 |
|||||||||||||||||||||||||||

|
|||||||||||||||||||||||||||
 |
|||||||||||||||||||||||||||
| The Harriet and Robert Heilbrunn Department of Population and Family Health |
|||||||||||||||||||||||||||
 |
|||||||||||||||||||||||||||
intro | use demographic stats | rates & indices | measures of the total population | conclusion | exam |
|||||||||||||||||||||||||||
Measure of the Total Population Structure and Size
Population Size and DistributionTotal Population (P): The total population or size of a community, defined geographically or administratively, is the number of persons residing there. It includes persons living in households or families and the “institutional” population, e.g., persons in dormitories, jails, military barracks, and other “group quarters.” The total population is assessed at regular intervals by the national census. Between censuses, the total population is estimated, either by extrapolation from the last census, or through more complicated “component” methodologies, which involve mini-projections of separate components of the population up to the target estimate date. Population by age and sex: The building block for virtually all demographic rates is a breakdown of the total population by age and sex. Population distributions may be reported as the total population in each age group or as the percent of total population in the age groups. If you have an age distribution but not by gender, you will have to apply a sex ratio to split the population into the appropriate genders. The preferred groups for this breakdown are 5 year age groups, if possible, with a subdivision of the first age group into under age 1 and 1 through 4 years of age. Demographers typically describe these age groups as 5-9, 10-14, and so on using the word “through” (e.g. five through nine). Descriptions of survival rates use the alternate terminology “to” to mean “up to, but not including”. Often, however, population will be reported in more aggregate groups: 0-4, 5-14, 15-49, 50-64, 65+, or just 0-4, 5-19, 20-64, 65+. To become familiar with typical age distributions (often summarized in population pyramids) typical population pyramids are shown below, for four different demographic regimes: High fertility and high mortality; high fertility and dropping mortality, transitional lower fertility and lower mortality, stable low fertility and low mortality. Ranges for age distribution (percentages):
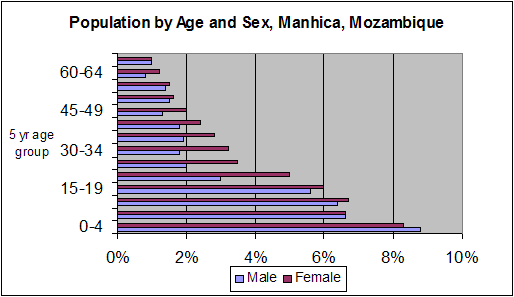
The following is a quick pyramid done with the graph function of excel, for Manhica, Mozambique, using data collected by their In-Depth Network site. Note the excess of females over males in the working age groups. This reflects the heavy out-migration of males for work to nearby Maputo.
|
|
||||||||||||||||||||||||||
 |
|||||||||||||||||||||||||||


