You have accidentally filled your glass to the brim with ice cold water and are walking slowly back to your seat in an effort to avoid spilling your glass of water. But someone calls your name and your head whips around to acknowledge the caller, and all of a sudden, your hands wobble a bit and some water spills from the glass. With horror, you turn your head back around to see the damage the spilled water has caused. Has it touched your brand-new suede sneakers, which are not waterproof? This is the question we will endeavor to study in our project. Dropped from different heights, how large will the splash of water that hits the ground be? Unfortunately, people often spill liquids because of overfilled containers or a lack of necessary balance. When scientists spill toxic chemicals in a laboratory, knowing the spread of the spilled chemical, which one cannot always see, is very important in the clean-up process; neglecting to clean up certain toxic chemicals can be very dangerous for the environment. Though the density of such chemicals and water is not the same, water can serve as a sample liquid in determining the extent of such a spill, and investigating how the size of the splash when water hits the ground varies as the height from which it falls changes will provide valuable insight relating to the improvement of the clean-up of chemical spills. This study can also answer practical questions such as whether the spilled water will hit the sneaker and how far you should have held the glass of water away from your body to prevent any water from splashing on you if a spill occurred in the first example. Conducting this experiment, collecting accurate data, and using statistical tools to organize the data will give us a better understanding of the effects of spills.
Our group has decided to study the spread of the spill of water when dropped from different heights. We will perform the experiment on the floor of Seth's lounge in Hartley Hall on Friday, February 20th at 3:30 p.m. Based on information gained from some preliminary trials (before data collection began), we will perform the experiment at 3-inch intervals, starting at a height of 3 inches and finishing at a height of 24 inches. We will perform the experiment on a carpeted floor covered with 20-lb 8.5 x 11 white recycled paper; based on our preliminary trials, we determined that we will need to cover an area measuring 8 feet in diameter with paper on the floor. We will tape wax paper to the carpet (we will do our best to lay the wax paper flat on the ground so there will be no error resulting from bumps in the wax paper) over which we will place the white paper (which will then be taped to the wax paper) to prevent leakage from the white paper onto the carpet. We will use new sheets of white paper for every trial.
In preparing the water samples, we will fill a container with tap water and add a few drops of red food-coloring dye to the water so that we will be able to see the water when it lands on the white paper. We will use a ˝ tablespoon measuring spoon to drop the water onto the paper. Seth will pour ˝ tablespoon of red-colored water into the spoon, while Tabia measures the distance above the white paper to determine the correct placement of the spoon. Once the spoon is held facing upwards at the proper height (the explanatory variable) and in the middle of the area of white paper, Seth will turn the spoon 180 degrees and the water will land on the paper and splash in every direction. All three people will then examine the extent of the spill and determine the two splashes on the white paper that are located the farthest apart from each other. We will then use measuring tape to measure the distance (in inches) between the two splashes and Josie will record this value (the response variable) in a chart. We will organize the data into spreadsheet, and then we will plot the data on a scatterplot, graph the regression line, and determine the correlation. We will perform the experiment 3 times at each height in the hope that 3 trials will provide us with an accurate range of data by which we can determine the true extent of each spill when water is dropped from different heights.
While we will do our best to eliminate any potential experimental error, there are some possible problems we may encounter. The speed at which the spoon is turned, and consequently the speed at which the water begins falling, may be difficult to control. But we will try to minimize this variation by having the same person turn the spoon every time, and having that person turn the spoon as fast as he/she can. Another problem we may encounter is measuring the exact amount (1/2 tablespoon) of water into the spoon, but we will try to pour carefully and measure correctly every time. Another potential problem is our ability to see the extent of the spill, but with 3 sets of eyes looking at the pieces of white paper and with the use of the red dye, we think we will be able to spot every outlying splash. Another potential problem will be the appearance of false data due to improper cleanup from previous trials, so we will carefully wipe the entire area with napkins after each trial to ensure that no extra water remains and we will make sure that the clean white paper is kept separate from the used white paper.
In performing the experiment, we will try our best to control other factors so that we can accurately measure our explanatory and response variables. We are looking forward to studying the effects of spilled water and hope we can make reasonable conclusions from our data.
As Professor Zheng once said, "Statistics is a good field to go into because in doing research and/or experiments, one is expected to make mistakes." This experiment, like any other, had its share of error due primarily because there were things that were beyond our control and even when we tried our best to minimize that error, there was still a chance that the error existed. We ran into certain problems which we tried our best to ameliorate, but unfortunately, those problems provided for different sources of error in the different stages of our experiment. As mentioned in the "Data collection design: protocol" section, such errors included: how full the measuring cup was and how fast it was turned, which obviously would affect the rate at which the water began to fall, which would ultimately affect the splashes, and the error in measuring between the two longest splashes, as well as false data due to improper clean-up.
When we started the experiment, we incurred some problems that might have been responsible for some error in our data. As mentioned before, we used wax paper underneath the white paper and taped the edges to the floor so that the wax paper would stay in place. However, there is a possibility that in taping the paper to the floor, we did not properly stretch the wax paper, leaving small "bumps" underneath the white paper, which would obviously affect the spill of water and consequently, would affect the splashes on the paper. Also, this same type of error could have occurred because of the white paper being taped to the wax paper and moreover, the indents in the white paper (since we put pieces of paper together to create the space where the water would splash) could have also provided an environment for errors. Relating to this, another problem that we had no control over was the unevenness of the floor on which we did the experiment. There were no obvious "slants" on the floor, but there could have been some type of distortion nonetheless. In conducting the actual experiment, we ran into another source of error-the keenness of our eyes, which was necessary to properly correspond the height of the ˝ tablespoon with the measuring tape and to look for the farthest splashes. We had to rely on our vision to measure these things, which unfortunately is not perfect.
Although these errors may portray our data and conclusion as misleading, we did our best to reduce all possible errors and carry out an accurate experiment. If we had an opportunity to use more sophisticated tools, we believe that our data and summary would be more precise. We must also keep in mind that some situations were beyond our control and like in any other experiments, will provide some chance of error, no matter how small this chance may be.
The data collected revealed a relationship between the height from which water falls and the diameter of the splash it creates upon impact. ˝ tablespoon portions of water were dropped from various heights. This created a splash as displayed by Figure 1.
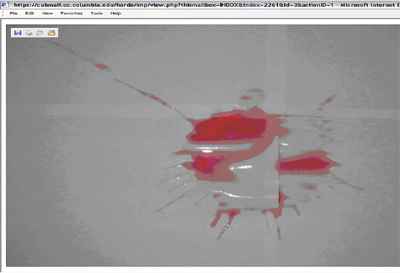
Splash created by dropping water from height of 3"
The circle of the splash is defined as a circle on which lie the two drops of water from the splash which have the greatest amount of distance between them. The data consists of the heights at which the water was dropped and the measurements of the diameters of the various circles created by each trial as displayed by Figure 2.
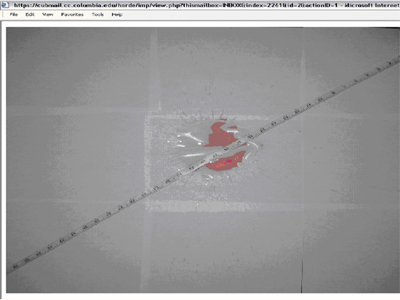
Measuring the splash created by dropping water from height of 9"
The explanatory variables of the data set are heights set at 3" intervals. There are eight heights; the minimum is 3", and the maximum is 24". The response variable is the diameter of splash. At each height, three observations were taken to decrease the variation generated by chance; hence, there are three diameters associated with each height. Each measurement is rounded to the nearest 1/8". The average of each grouping of three diameters rounded to the nearest 1/10000 of an inch is included in the final data set used to create the scatterplot. The range of averaged diameters is 4.2083" to 64.625".
The distribution of the data has several other interesting characteristics. The average height is 13.5" and the standard deviation of height is 7.3485. The variance of height is 54. The average diameter is 27.7344" and the standard deviation of diameter is 22.6253. The variance is 511.9047. There is a clear relationship between height and diameter. The overall pattern of the included scatterplot features a linear form. The variables are positively associated. The association is strong. The correlation of the variables is 0.9656. The least-squares regression line is yhat=4.8019+0.3136x.
Several statistical concepts were explored in the completion of the experiment. We achieved a greater understanding of the importance of numerous observations in compiling reliable data for statistical analysis. At each height, three splashes were measured to minimize the impact of chance on the results. This improved the quality of data. For example, at a height of 3", one diameter was measured to be 5", a value larger than one recorded for the splash created by dropping water from a height of 6". Several non-recurring factors could have contributed to this large, unusual value. They include the force exerted on the water by the turn of the spoon or inaccuracy of the measurers. The effect of these factors on the data is decreased by averaging the large value with other, typical values; the average diameter for a height of 3" is 4.2083".
Another concept is the value of varying only one variable in an experiment to produce meaningful results. We desired to vary only the height in each trial. To accomplish this goal, we attempted to preserve as many of the same conditions as possible throughout different trials. For example, one solution of water and food coloring was used in all trials to minimize any differences created by the food coloring. The wax paper was carefully cleaned between each trial to prevent any liquid deposited on the wax paper in previous trials from compromising the accuracy of measurements in subsequent trials. One procedure for assigning a measurement to each splash was followed in every trial.
A third statistical concept is the significance of identifying causes of error. Identification of sources of inaccuracy is necessary to refine the experimental procedure to reduce the effects of the sources or adjust the interpretation of the data to account for possible inaccuracies. For example, in the early, developmental stages of the experiment, we attempted to use plastic bags to cover the floor; however, this idea was abandoned because the uneven surface of the plastic bag could have affected the findings. The plastic bag was replaced by wax paper, a material with a smooth surface.
As a result of the careful procurement of data, the data collected can be used to answer the question. The purpose of the experiment was to answer the question: Dropped from different heights, how large will the splash of water that hits the ground be? The data of the experiment provides answers to the size of the splash created by dropping water from various heights. It also explains the relationship between height and diameter of the splash to aid people in assessing the size of splashes of spills of several other substances including chemicals. As the height increases, the diameter of the splash increases as well.
The design of the experiment is unbiased. According to the design of the experiment, the population is dyed water. The portions of dyed water used were randomly selected. Hence, the sample should be an accurate reflection of the population. The average of the value of a feature (ex. mean) of the sampling distribution should equal the related parameter of the population. Hence, if all the dyed water on earth was used to conduct the experiment, the average diameter of the splashes observed in all trials of the experiment should be 43.8906".
There are many ways to analyze this data. Many are related to linking the information produced by experimenting with the sample to the population and proving the validity of the results. One is to determine the confidence interval to form approximations on the parameters of the population. Another is to perform a test of significance. In this test, the null hypothesis would be that height does not influence the diameters of splashes created by water dropped from different heights. The alternative hypothesis would contradict this. The results of this test will prove if the data is statistically significant. In addition, the power of the significance test should be determined to assess how likely the test will uncover the alternative hypothesis. The validity of the alternative hypothesis may also be tested by using the decision theory.